
NBA Shot Charts
January 28, 2017
In January 2017, I tried my hand at making NBA shot charts. These charts are primarily an extension from the work of Dan Vatterott and Savvas Tjortjoglou. I made an attempt to combine my favorite aspects of other shot charts on the internet (primarily from: Kirk Goldsberry, Buckets (by Peter Beshai), BallR (by Todd Schneider), and Swish (by Austin Clemens)) into one image, while also adding some additional features I thought would be nice in order to better distinguish the amount of value added by a player.
For those interested in re-creating these charts, creating their own, or learning more about the features of these charts, the full codebase is available on my github.
For those interested in looking at the charts I've already made, a description of the various metrics and how I use the charts can be found here, feel free to follow my twitter bot (@NBAChartBot) that posts a pseudo-random shot chart on a regularly scheduled basis, or click here for a full directory of player or team charts. Finally, the code for this bot is also on my github.
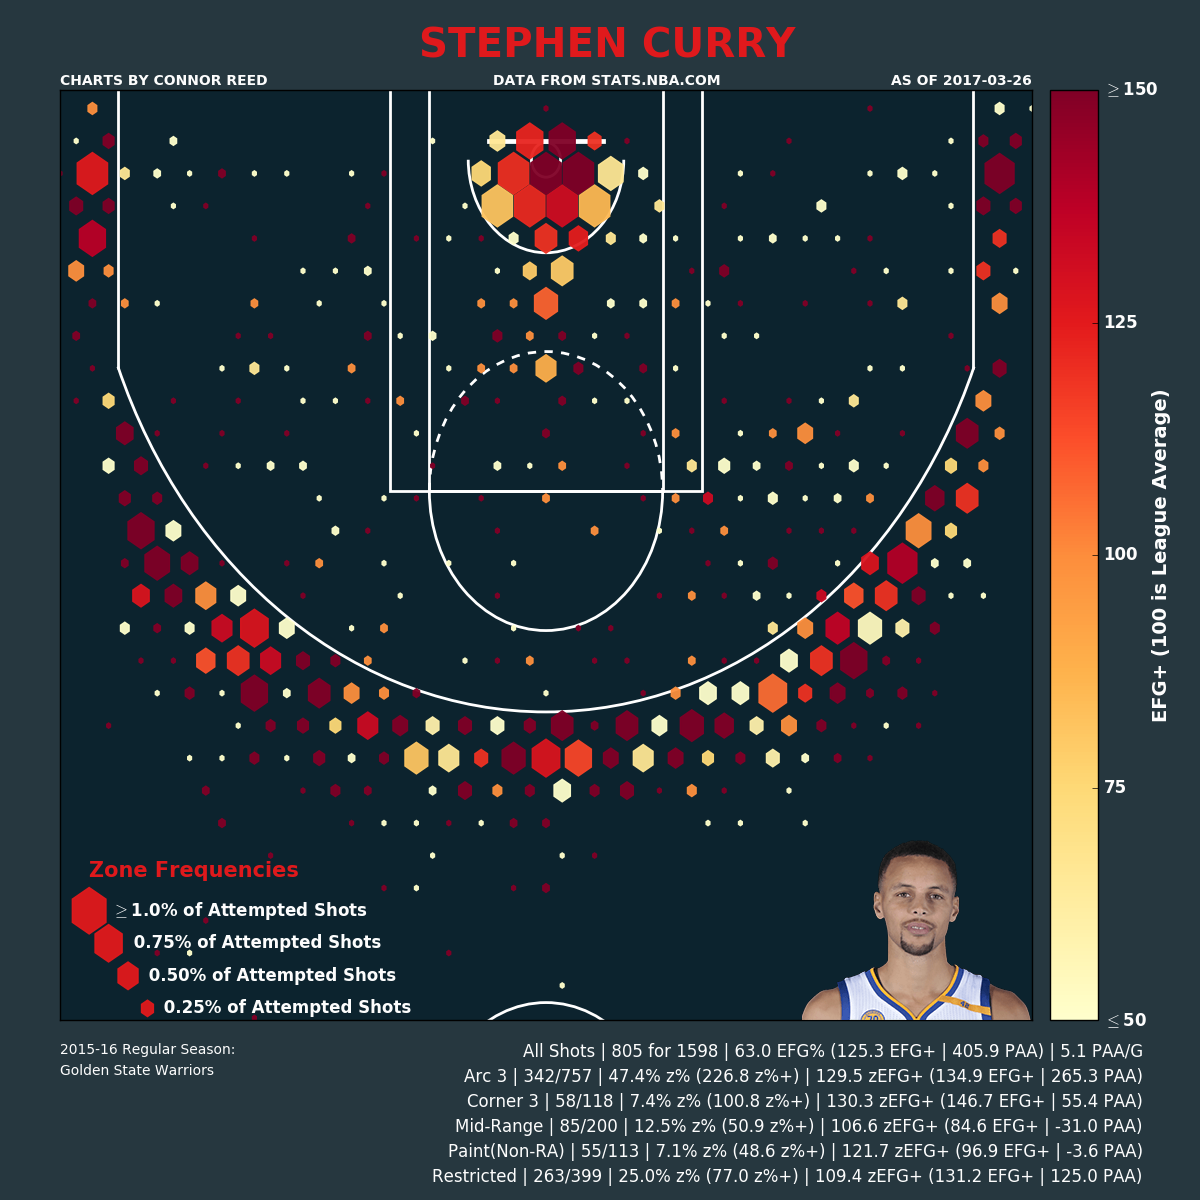
The chart to the right is from Stephen Curry's historic 2015/16 season, in which he became the NBA's first unanimous MVP. He sank 402 3 point shots (obliterating the NBA record), added 406 points over an average NBA offense (highest on record), and posted an EFG+ of 125 (highest on record for player with > 800 shots in season).