Simulation Baseball Team Level Projections
December 27, 2016 Updated July 1, 2018
I have participiated in Diamond Mind Baseball (DMB) simulation leagues since I was 16. The general idea of a simulation league is to use statistical projections for players to simulate, using the DMB software, a complete 162 game season running parallel to the real life MLB season. The league I participate in has used the ZiPS projection system provided by Dan Szymborski.
While this remains one of my favorite recreational pastimes, in the past couple of years I have shifted towards an extremely data driven approach to run my particular team. This has involved re-shaping my thinking process and decision making approach to be more objective and less subjective than when I started in 2008. For example, I reverse-engineered certain parts of projection system our league is based on and now have more detailed player projections for every player in the league which helps lessen personal biases in decision making processes regarding player transactions or roster movement. Additionally, I created an automated tracking system for the top available minor league and amateur players available in the league that helps me track player performance and trends for the best draft eligible players, which you can read about here. Finally, the part of my process I'm most proud of, the part that is most valuable as well as certainly the most computationally difficult part of my process, is my team level projections.
While it is true that since it is a simulation league, one could sit down and run a large number of simulations and use that number to determine the general strength of each team. However, this both fails to compensate for any injuries that may happen during a simulation as well as being very time consuming. Therefore, I created a ground up theoretical model for projecting the performance of each team. First, I have done research on how players perform relative to their projections, resulting in the ability to generate a Gaussian distribution curve for each player projection within the simulation. From these projections, I use an implementation of the Hungarian algorithm to create optimized pitching rotations and optimized batting lineups against left- and right-hand opposing pitchers. Next, by treating every player as a independent random variable, I can create a team-level distribution which leads to a projection of each team's win-loss record and the amount of expected variance given their optimal roster construction. Finally, using these projections and MLB's playoff structure I can compute the probability of each team's advancement to various playoff rounds by using the Log5 odds ratio to predict the likelihood of a team winning a single game, and the binomial probability mass function to predict the likelihood of winning a 5 or 7 game series as appropriate.

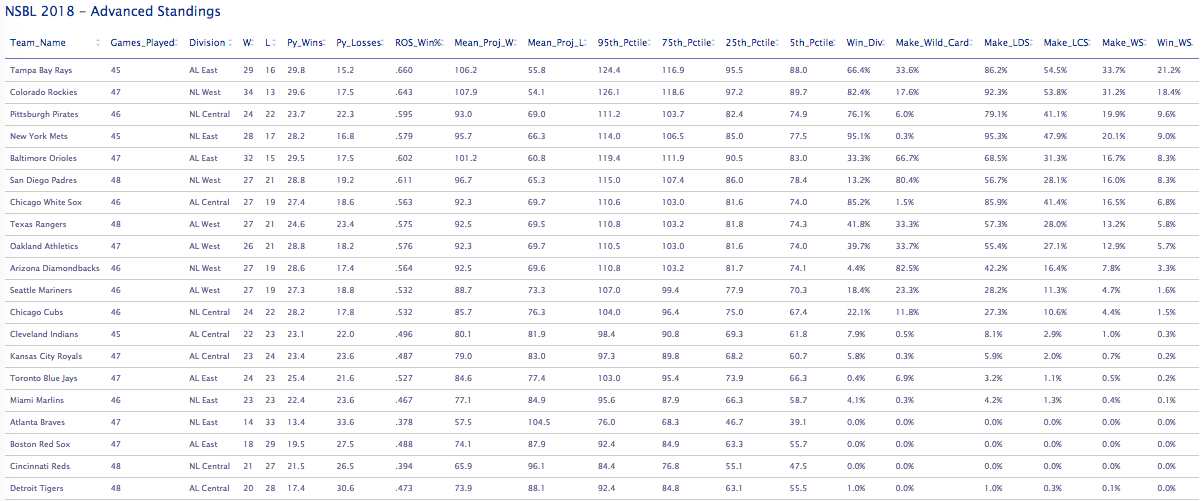
2018 NSBL Projected Standings and Playoff Odds (through ~1/4 of the season)
During the season, I maintain updated tables for rest of season projections as well as weekly changes in playoff probabilities.
All scripts for my team level projections are available on github, as well as the full codebase for my simulation league research and analysis. This code has scripts capable of building a MySQL database, populating the tables by scraping the league and additional sites, post-processessing the data into a myriad of advanced metrics, computing historical statistics, analyzing prospects for an amateur draft, optimizing team rosters, and predicting team-level outcomes. If you're interested in just seeing the results and not the process, a full (relatively up-to-date) backup of the database (both SQL and .csv format) can be found on Dropbox.